Stop Building Integrations. Start Publishing Data.
Building Business Agility: The Open Data Monitoring Architecture

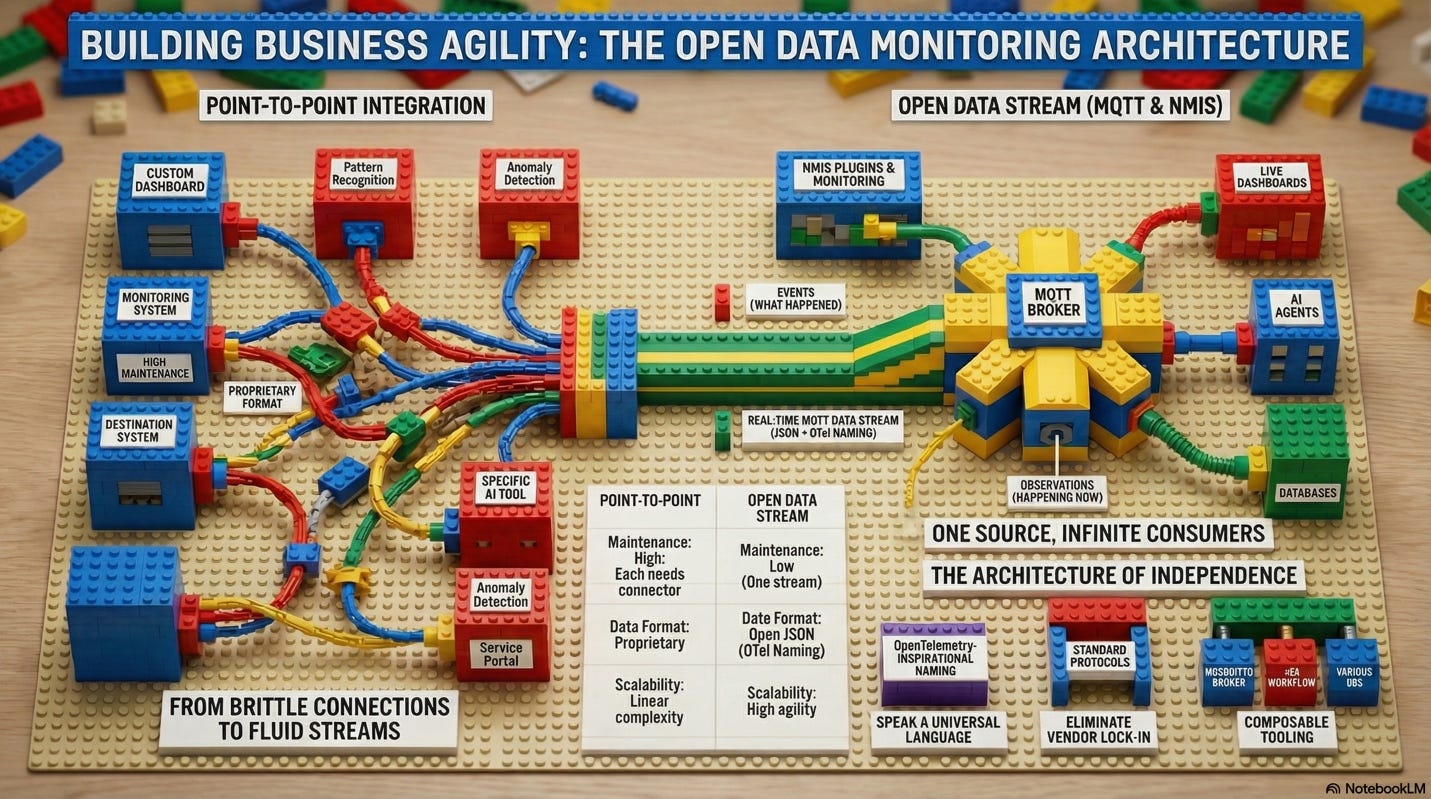
Most monitoring architectures are point-to-point. Your NMS sends events to email, metrics to a dashboard, alerts to a ticket system. Each destination requires its own connector, its own configuration, and its own maintenance burden. Want to add a new consumer? Build another integration. Want to change how the data is processed? Modify the source system.
This approach does not scale, and it creates vendor lock-in at the data layer. There is a better way.
In the article NMIS, MQTT, and Why Open Source Flexibility Still Matters I showed how nmis-mqtt-event publishes NMIS events to an MQTT broker as structured JSON. Since then, I have built nmis-mqtt-observations to do the same for performance data. Together, they create a complete real-time data stream from NMIS, and the principles underneath matter far more than the code.
From Events to Observations
The event plugin answered the question: how do we get alerts out of NMIS and into any downstream system? The observations plugin answers the next question: how do we do the same for metrics?
It runs automatically after each NMIS poll cycle and publishes metric data organised by node and measurement type to an MQTT broker as flat JSON messages. Interface throughput, CPU load, storage, disk I/O, ping results, health scores. Each metric type gets its own topic, and the payload uses OpenTelemetry-inspired field naming so the data is immediately understandable without knowing NMIS internals.
Events tell you what happened. Observations tell you what is happening right now. Both published to a broker, both available to any subscriber. That is the foundation. What matters is what you can do with it.
One Data Source, Many Consumers
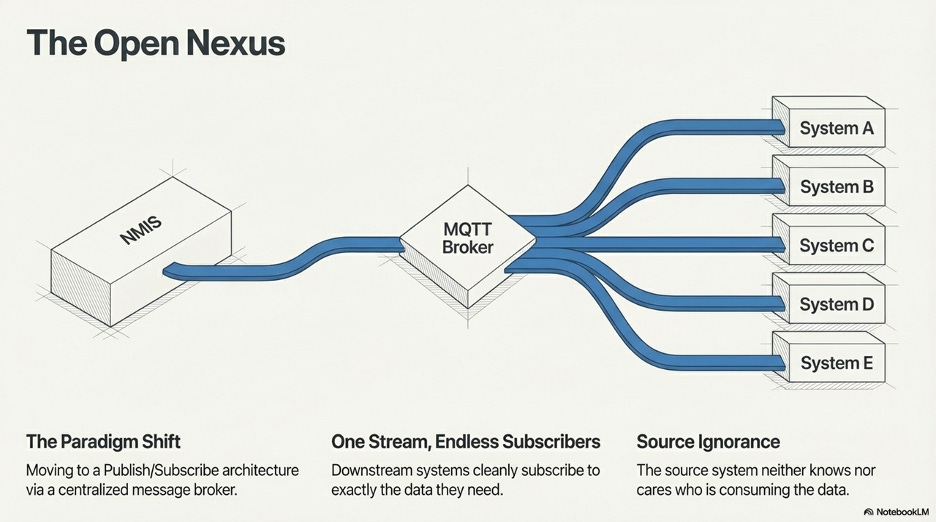
Once your monitoring data flows through MQTT as structured JSON, any number of downstream systems can subscribe to exactly the data they need without the source system knowing or caring.
The same interface throughput observation feeds your Grafana dashboard. Simultaneously, it feeds an n8n workflow for capacity planning, a Node-RED flow correlating application performance, an AI agent performing automated triage, and a data lake for trend analysis.
You build the data stream once. Every new use case is a new subscriber, not a new integration in the source system. That is a fundamental shift in how you think about your monitoring architecture, and it applies well beyond network management.
Open Data, Open Source, and Why Both Matter
This works because both the data and the tools are open.
The data is open in the architectural sense: published in a standard format, to a standard protocol, with no proprietary wrapper or vendor-specific encoding. Any system that can subscribe to MQTT and parse JSON can consume it. The OTel-inspired field naming is part of this. When an interface metric is called system.network.io.receive rather than ifInOctets, any engineer or system that understands OpenTelemetry conventions can work with the data immediately. The data describes itself.
This is what prevents vendor lock-in at the data layer. If your downstream integrations depend on a proprietary API with proprietary field names, switching your monitoring platform means rebuilding every integration. If they consume standard MQTT messages with OTel-named fields, your monitoring platform becomes replaceable. The integrations survive because they depend on the data standard, not the data source. That is business agility in the practical sense: your organisation can change its monitoring platform without a six-month integration rebuild project.
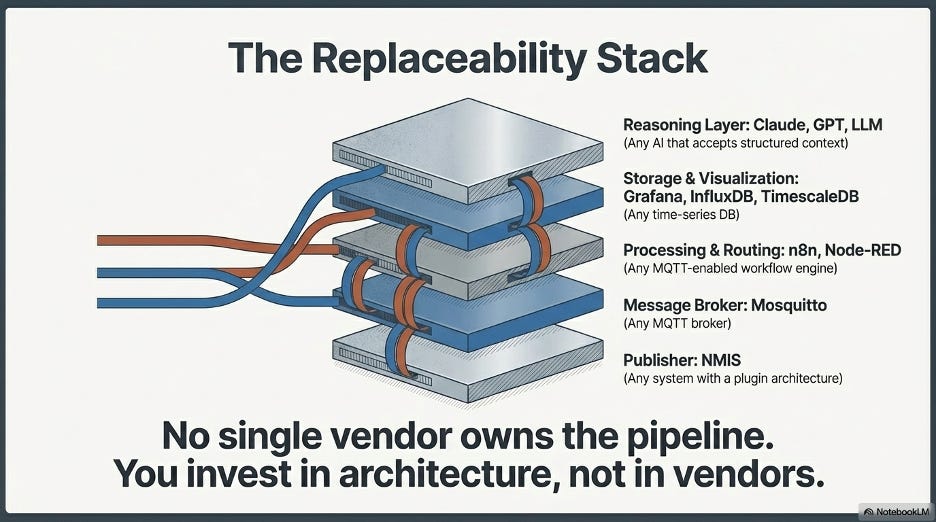
The tools are open in the same way. Every piece of this architecture is independently replaceable:
NMIS publishes the data. Any monitoring system with a plugin architecture could do the same.
Mosquitto brokers the messages. Any MQTT broker works.
n8n or Node-RED processes and routes the data. Any workflow engine that subscribes to MQTT works.
Grafana, InfluxDB, TimescaleDB store and visualise it. Any time-series database works.
Claude, GPT, or any LLM can reason about it. Any AI that accepts structured context works.
No single vendor owns the pipeline. You invest in architecture, not in vendors. Your integrations are assets that appreciate over time as you add new subscribers, rather than liabilities that depreciate every time a vendor changes their API or licensing model.
Built with Claude Code, Upstreamed to NMIS
Both plugins were built in collaboration with Claude Code. I brought the architecture and NMIS domain knowledge. Claude Code handled the implementation mechanics, OTel field mapping tables, error handling, test scaffolding, install scripts, and documentation. What would have taken weeks of evening coding sessions was done in hours. More importantly, the release artefacts were better than what I would have produced alone. Claude Code did not just accelerate the coding. It eliminated the friction that stops useful code from becoming a public release.
Both plugins have been upstreamed to the NMIS9 contrib directory, making them part of the NMIS project itself. A plugin in a personal GitHub repository helps the people who find it. A plugin in the project’s contrib directory is part of the ecosystem: discoverable, maintainable, and visible to anyone evaluating what NMIS can do. If you build something useful on top of an open source project, upstream it. The project benefits, the community benefits, and your code gets better because it is used more broadly.
Where This Is Heading
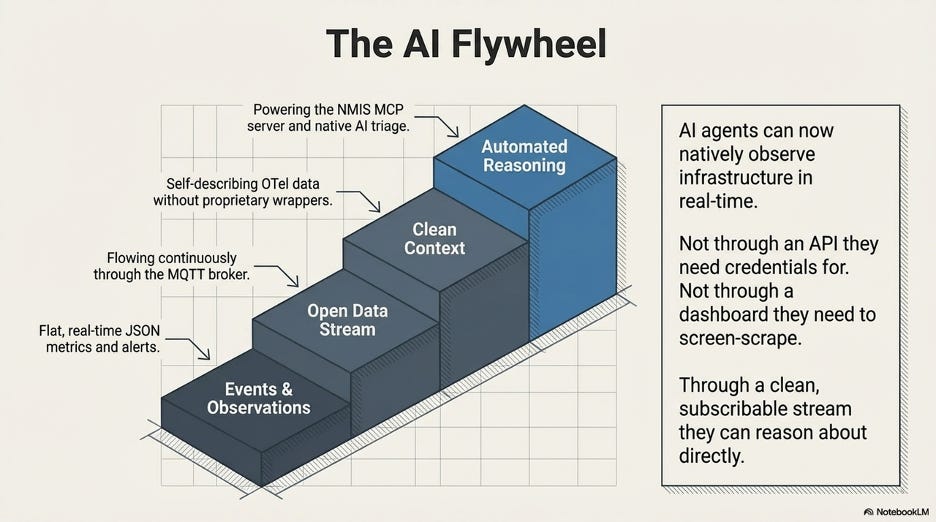
The combination of open data streams and AI creates something genuinely new. When your monitoring data flows as structured, self-describing JSON through a message broker, you have given AI agents the ability to observe your infrastructure in real time. Not through an API they need credentials for. Not through a dashboard they need to screen-scrape. Through a clean, subscribable data stream that they can reason about directly.
That is the architecture I described in earlier articles about automated triage and the NMIS MCP server. Each piece builds on the one before it. Events, observations, context, reasoning. All open, all composable, all independently improvable.
The infrastructure monitoring data you already have is more valuable than you think. You just need to set it free.
Keith Sinclair is the founder of NMIS and has spent his career designing and building infrastructure management solutions. The nmis-mqtt-event and nmis-mqtt-observations projects are available under GPL-3.0. Both have been upstreamed to NMIS9 contrib.